
Gambling Statistics That Actually Matter in 2026
Your betting product can look healthy while the numbers underneath tell a different story. Gambling statistics matter because margins, retention, channel mix, payment friction, and safer gambling signals now decide who grows and who burns cash. Regulators are asking sharper questions, affiliates are fighting for cleaner traffic, and players can switch brands in seconds, so a headline revenue figure is no longer enough. The useful data sits lower down: active accounts, gross gaming revenue, hold percentage, bonus cost, failed deposits, churn, complaints, and intervention rates. I have covered this beat long enough to distrust any chart that only points up, because the missing context is often where the real story lives.
The Numbers Worth Watching
- Gross gaming revenue is only a starting point. You also need bonus spend, tax exposure, payment costs, and withdrawal speed.
- Active player data beats registered account totals. Dormant users do not fund a business.
- Retention tells you more than acquisition. Cheap sign-ups can hide weak product fit.
- Safer gambling metrics now carry commercial weight. Poor controls invite fines, churn, and reputational damage.
- Market-level data needs local context. Rules, sports calendars, payment habits, and tax rates change the read.
Why Gambling Statistics Matter Now
The European Gaming gambling statistics page is useful as a starting point because it pulls attention back to the hard numbers behind online gambling, sports betting, casino, and related verticals. But a good operator, investor, or affiliate should treat any market snapshot as the first question, not the final answer.
Public data from sources such as the UK Gambling Commission, Malta Gaming Authority, and American Gaming Association can show broad direction. Internal data shows whether your own house is in order, especially around deposits, player value, bonus dependency, and risk signals.
Revenue without retention is noise, and retention without responsible controls is a liability.
How Gambling Statistics Expose Player Behavior
The strongest gambling statistics usually describe behavior, not vanity totals. Registered accounts, app downloads, and first deposits can look impressive, but they do not prove that players trust the product or return without being bribed by bonuses.
- Monthly active users: Shows whether the product has repeat demand.
- First-time depositors: Helps separate traffic volume from real conversion.
- Average revenue per user: Useful only when paired with player protection checks.
- Churn rate: Shows how fast the audience leaks away after sign-up.
- Bonus-to-revenue ratio: Reveals whether growth is being rented through promotions.
Bad data makes confident people expensive.
Look at the pattern between deposits and active users. If deposits rise while active players fall, are you growing or squeezing the same audience harder?
Do Not Read Hold Percentage Alone
Hold percentage can swing because of sporting results, game mix, player luck, or bonus design. A sportsbook can have a brilliant month because favorites lost, while the underlying product still has weak pricing or poor retention.
Casino data has its own traps. Slot-heavy revenue may look stable, but game volatility, VIP concentration, and withdrawal friction can distort the picture if you only review aggregate gross gaming revenue.
- Segment hold by product, such as sportsbook, slots, live casino, poker, and virtuals.
- Compare hold against active players, not only stakes.
- Track bonus cost beside revenue, so promotions do not hide weak margins.
- Review outlier players separately, especially VIPs and arbitrage-heavy accounts.
Using Gambling Statistics for Payments and Finance
Payments data is often where the commercial story gets blunt. A slick front end means little if deposits fail, withdrawals drag, or chargebacks pile up behind the curtain.
You should track approval rates by payment method, issuer, country, currency, and device. And yes, failed withdrawals count too, because they damage trust even when the sportsbook or casino has technically done nothing wrong.
The Payment Metrics I Would Put on Every Weekly Report
- Deposit approval rate: Split by cards, bank transfer, e-wallets, open banking, vouchers, and crypto where legal.
- Average withdrawal time: Track median time, not only best-case processing.
- Chargeback rate: Watch this by channel and affiliate source.
- KYC drop-off: Measure how many users quit during identity checks.
- Payment cost per net revenue unit: Helps finance teams spot expensive growth.
Reading payment data without player cohorts is like judging a kitchen by oven temperature alone. You need to know what was cooked, who ordered it, and whether it came back cold.
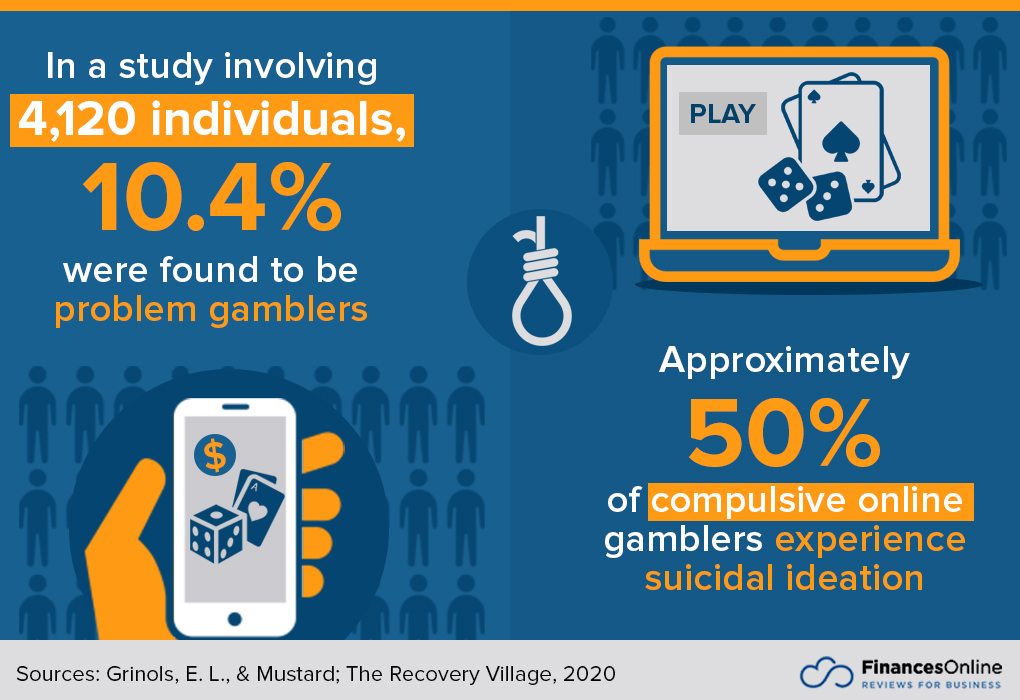
Gambling Statistics and Safer Gambling Risk
Safer gambling is no longer a side report for compliance teams. In mature markets, it shapes product design, CRM rules, affordability checks, advertising limits, and board-level risk planning.
The core issue is simple. If your best revenue months coincide with spikes in complaints, failed affordability checks, self-exclusions, or late interventions, the business has a structural problem.
- Self-exclusion volume: Track by product, channel, and time since registration.
- Deposit limit changes: Watch for rapid increases and repeated limit removals.
- Session length: Review long sessions with losses, not just time on site.
- Customer complaints: Classify by withdrawals, bonuses, account closure, and responsible gambling.
- Intervention outcomes: Measure whether risk messages reduce harmful patterns.
Good operators use these signals before a regulator forces the issue. Poor operators wait for a fine, then pretend the dashboard was always on the roadmap.
Where Affiliates Can Use Gambling Statistics Better
Affiliates often talk about traffic, rankings, and conversion, but the better ones care about player quality and compliance. That shift matters because operators are under pressure to prove where their customers came from and how they were marketed to.
If you run affiliate campaigns, ask for more than a blended revenue share number. You need country-level conversion, verified first-time depositors, retention by source, bonus abuse flags, and complaint rates tied to traffic partners.
Simple Affiliate Checks
- Compare click volume with verified accounts, not only registrations.
- Separate paid search, SEO, email, influencer, and comparison traffic.
- Review compliance rejections by campaign.
- Track net gaming revenue after bonuses, chargebacks, and payment fees.
- Cut sources that drive complaints, even if they look profitable for one month.
This is where hype gets dangerous. A campaign that floods an operator with low-intent bonus hunters can look good on launch week and rotten by the end of the quarter.
How to Build a Better Gambling Statistics Dashboard
A useful dashboard should answer one question fast: what changed, and why? If your team needs twenty tabs to explain yesterday’s revenue movement, the reporting setup is serving the report writer more than the business.
Start with a tight set of metrics, then segment them by market, product, device, and acquisition source. Keep the dashboard plain enough that a product lead, finance manager, and compliance officer can argue from the same numbers.
- Set one definition for each metric. Everyone should agree on what counts as an active player, first-time depositor, and self-exclusion.
- Use cohort views. Compare players by sign-up week or month, not only by calendar revenue.
- Show net figures. Include bonuses, taxes, payment costs, and fraud losses where possible.
- Add risk signals beside revenue. Do not bury safer gambling data in a separate file.
- Review anomalies by hand. Spikes often come from sport results, payment outages, VIP play, tracking errors, or bonus mistakes.
What to Check Next
The next fight in gambling data will be over quality, not quantity. Operators already have mountains of numbers, but the winners will be the ones that connect revenue, player experience, payment health, and safer gambling signals without fudging the trade-offs.
If you are reviewing your own reporting this week, start with three questions. Which metric do you trust least, which bonus campaign looks profitable only before costs, and which risk signal would make you pause acquisition tomorrow?