Commercial Gaming Revenue Tracker: What the AGA Data Really Shows
If you track the U.S. gambling market, you need more than headlines. You need a clean read on where the money is coming from, which segments are moving, and whether growth is holding up or just spiking for a month. That is where the Commercial Gaming Revenue Tracker matters. The American Gaming Association uses it to report monthly commercial gaming revenue across slots, table games, sports betting, and iGaming in regulated markets.
That sounds dry. It is not. For operators, suppliers, investors, and policy teams, this tracker is one of the few national-level signals that can cut through noise. Are players spending more, or are promo budgets masking the picture? Which vertical is doing the heavy lifting? The answers shape staffing, product planning, and compliance conversations. And if you work in this business, you already know how fast a bad assumption can turn expensive.
What the Commercial Gaming Revenue Tracker tells you
The Commercial Gaming Revenue Tracker gives a monthly view of revenue from the legal, commercial casino market in the United States. It focuses on state-regulated activity and excludes tribal gaming, which is a key boundary if you want to compare apples to apples.
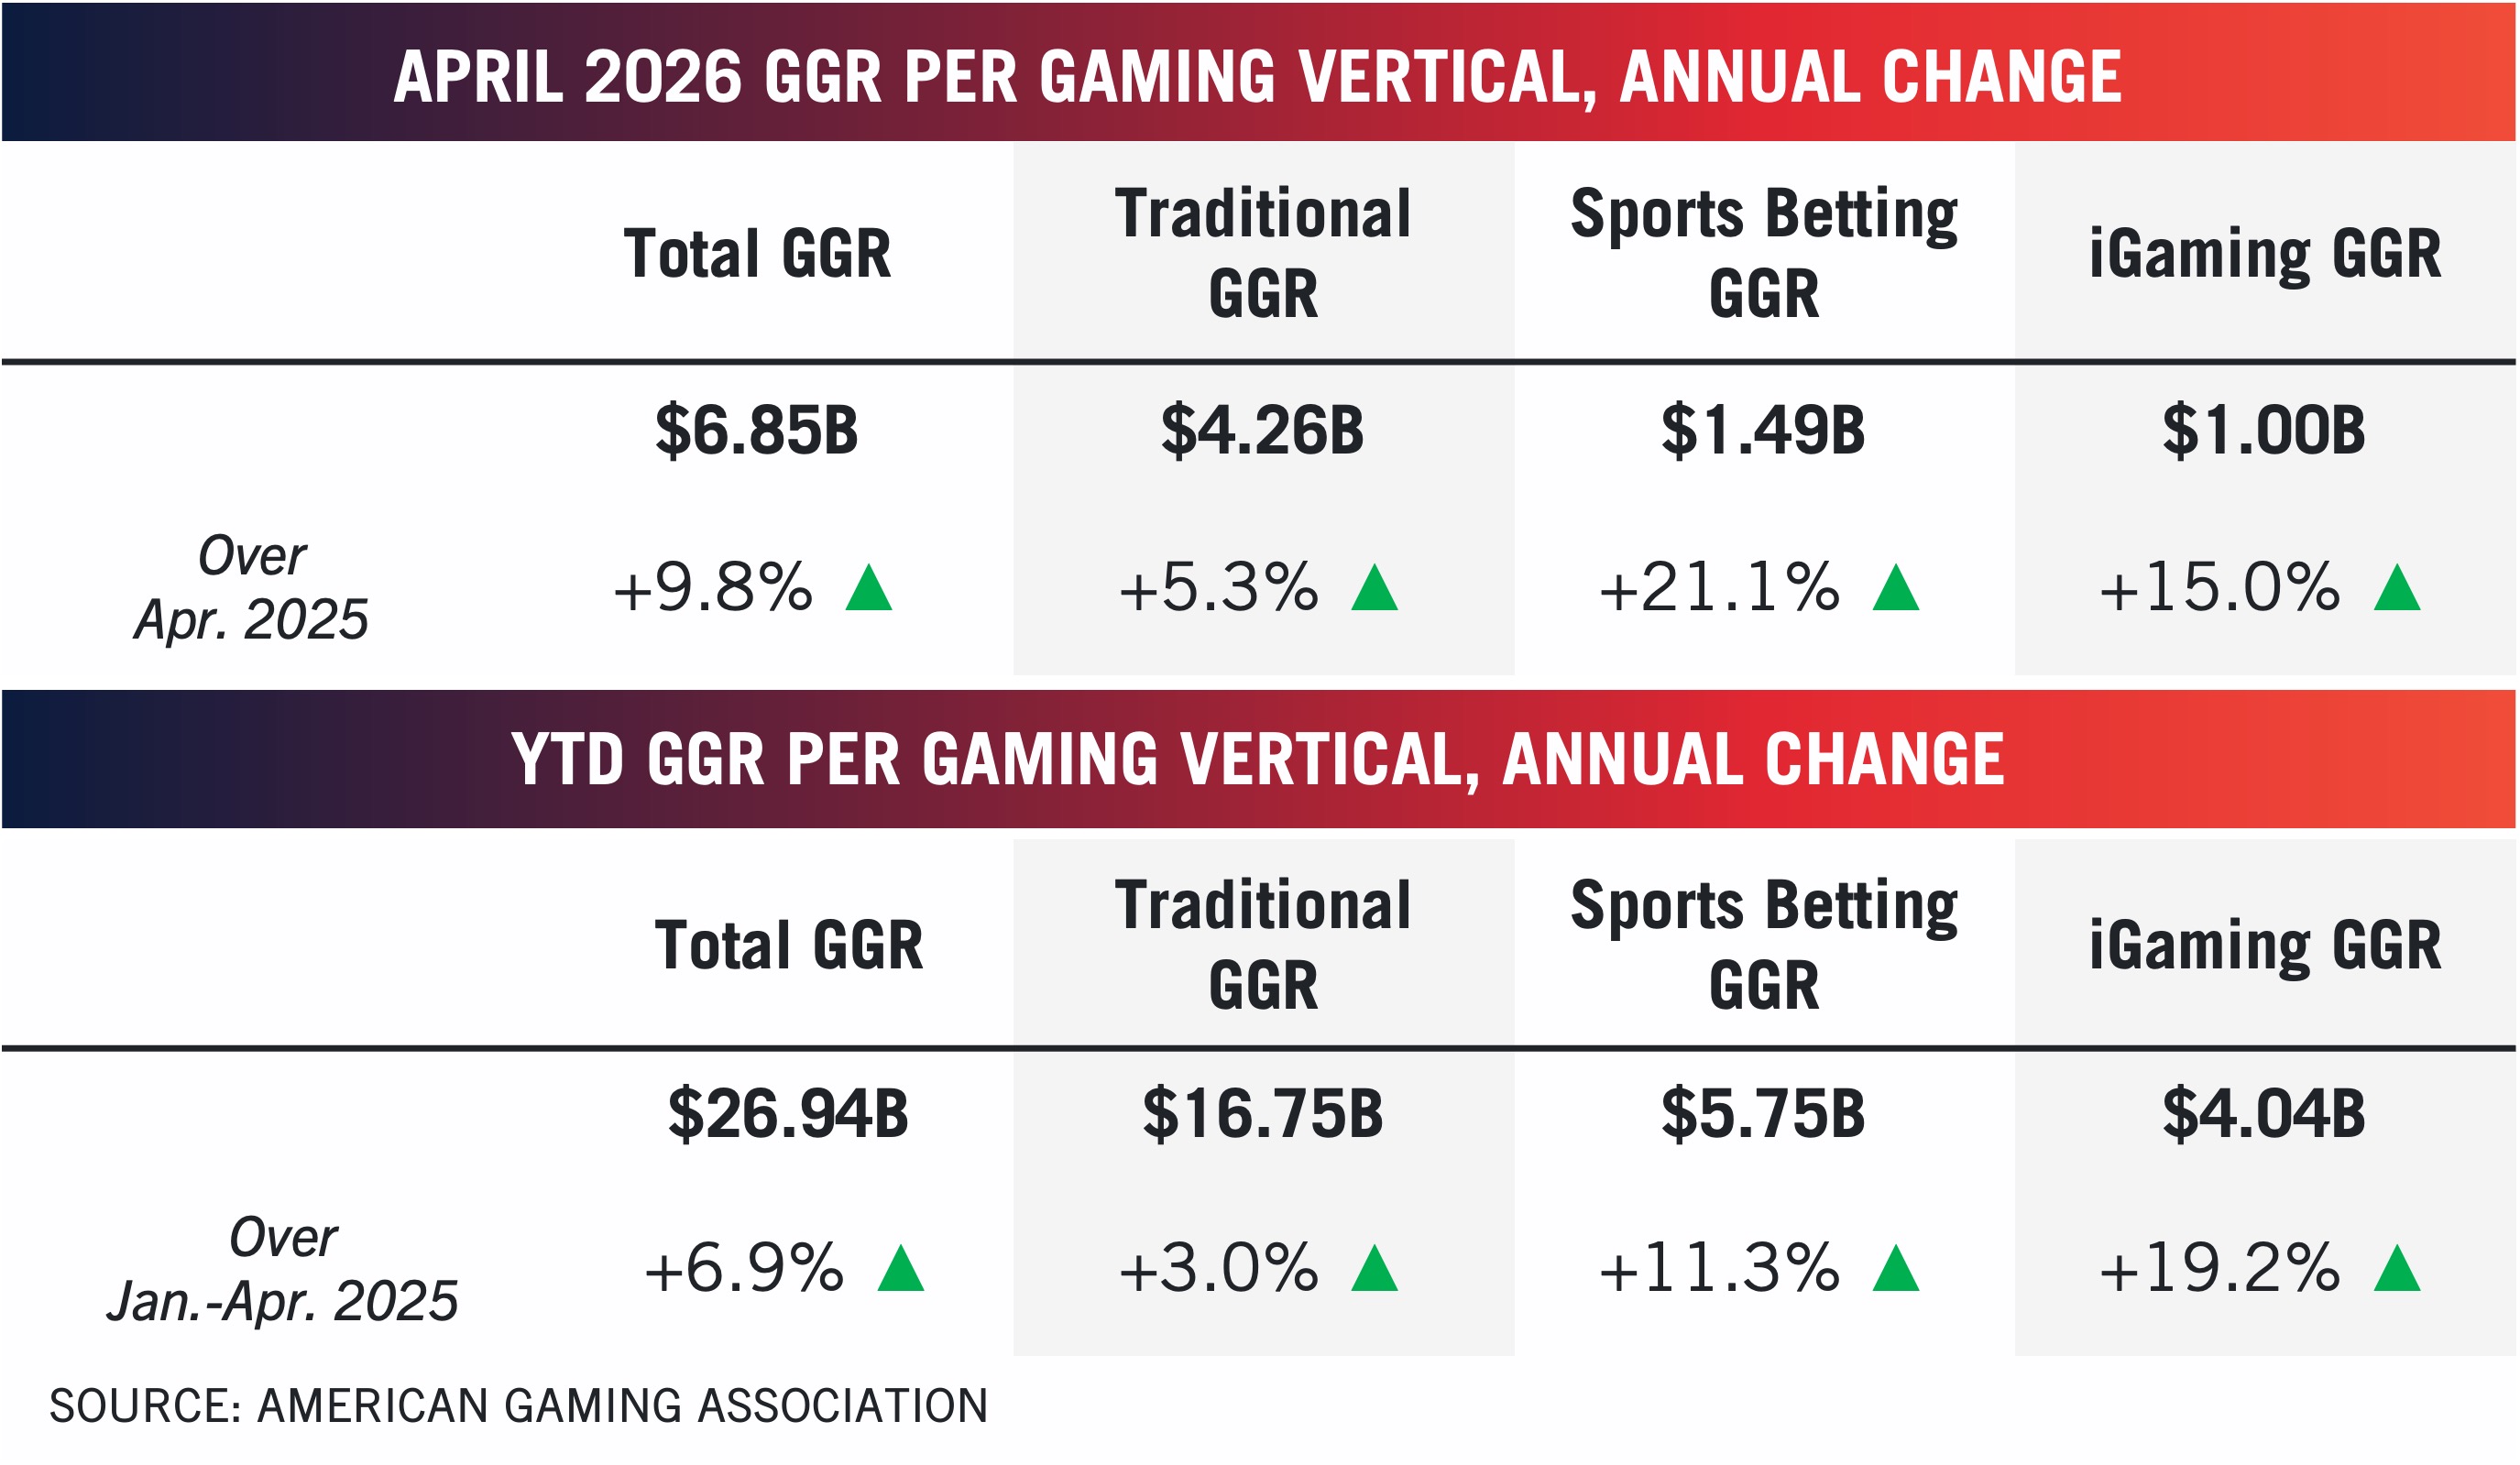
The AGA breaks out results by segment, so you can see how slots, table games, sports betting, and iGaming perform over time. That makes the tracker useful for spotting seasonal shifts, market mix changes, and the early signs of pressure in a specific vertical.
- Slots and table games show the core casino base.
- Sports betting shows handle conversion and hold trends in regulated states.
- iGaming shows online casino growth where it is legal.
- State-by-state results help you compare mature markets with newer ones.
The value is not just in the headline total. It is in the split between segments, because that is where the market’s real story sits.
Why the Commercial Gaming Revenue Tracker matters now
The U.S. gaming market has become more segmented, more competitive, and more dependent on state policy. A national revenue total tells you something. The monthly breakdown tells you much more.
Look at sports betting as an example. A strong handle number can still hide weak hold. iGaming can grow fast while retail casino traffic stays flat. That is why the tracker is useful. It forces you to look past the top line and ask what is actually driving it. Like checking each part of a restaurant bill instead of just the final total, you can see where the real cost and value sit.
This matters for pricing, bonus strategy, market entry, and regulatory planning. If one state slows while another surges, the average can fool you. The tracker helps you catch that before it becomes a bad quarterly story.
How to read the Commercial Gaming Revenue Tracker without getting fooled
If you use the tracker well, you should treat it like a starting point, not a verdict. Monthly gaming data can swing on calendar effects, big sporting events, and promotional timing. One strong month does not make a trend.
- Compare year over year first. Month-to-month changes can be noisy. Year-over-year data gives you cleaner direction.
- Check the segment mix. A rising total can hide weakness in a core business line.
- Watch state concentration. Big markets can skew national results.
- Separate mature and new markets. New launches often grow faster early on, then normalize.
- Pair revenue with policy changes. Tax shifts, launch timing, and licensing changes can move the numbers.
And here is the thing. Revenue data is only useful if you know what it does not say. It does not explain player behavior in detail. It does not show churn, acquisition cost, or margin pressure. You still need your own operating data.
Commercial Gaming Revenue Tracker and market strategy
For operators, this tracker helps answer practical questions. Should you lean harder into a market where casino revenue is stable but sports betting is soft? Should you adjust marketing in states where iGaming is pulling away from retail? Those are not abstract questions. They affect budget allocation now.
For suppliers, the data can show where demand is durable and where it is more fragile. A strong slot market may support hardware refreshes. A weak sports betting month may push operators to tighten spending on risk tools or promotional campaigns. That is the kind of read that separates planning from guessing.
For analysts and reporters, the tracker is a reliable baseline. It will not answer everything, but it gives you a common frame. Without that, market commentary turns into noise fast.
What to pair with the tracker
Use the Commercial Gaming Revenue Tracker alongside other sources if you want a fuller picture.
- State regulator reports for local detail.
- Company earnings calls for margin and customer insights.
- Industry reports for trend context.
- Tax data when policy effects matter.
That combination gives you the shape of the market and the mechanics underneath it. You need both.
Commercial Gaming Revenue Tracker and the bigger question
The best part of the Commercial Gaming Revenue Tracker is also its limit. It is clear, regular, and easy to cite. But it is only one layer of the market. If you treat it as the final word, you will miss the operational story behind the numbers.
Still, the tracker has real value because it keeps the conversation grounded. In a sector full of hype, that is non-negotiable. The next question is not whether the market is growing. It is which segment grows next, and who is positioned before the rest of the industry catches up?
Use the tracker as your monthly reality check, then test your own assumptions against it. That is where the useful work starts.